Last update: 03-02-2025
Introduction: The Future of the Nasdaq 100
The Nasdaq 100 Index (NDX) has been one of the best-performing stock indices in the last four decades, driven by major technology companies like Apple, Microsoft, Amazon, and NVIDIA. As of 2025, the index continues its upward trajectory, but technical indicators suggest a critical inflection point.
In this analysis, we break down:
- Technical trends & chart patterns for the long-term Nasdaq 100 forecast
- Key macroeconomic influences, including Federal Reserve policy and tech sector growth
- Performance comparisons with S&P 500, commodities, and bonds
- Investment strategies for traders and investors
Let’s dive into the most important insights for Nasdaq 100’s future price action.
1. Long-Term Technical Analysis of the Nasdaq 100
Broadening Wedge Pattern: Key Price Levels to Watch
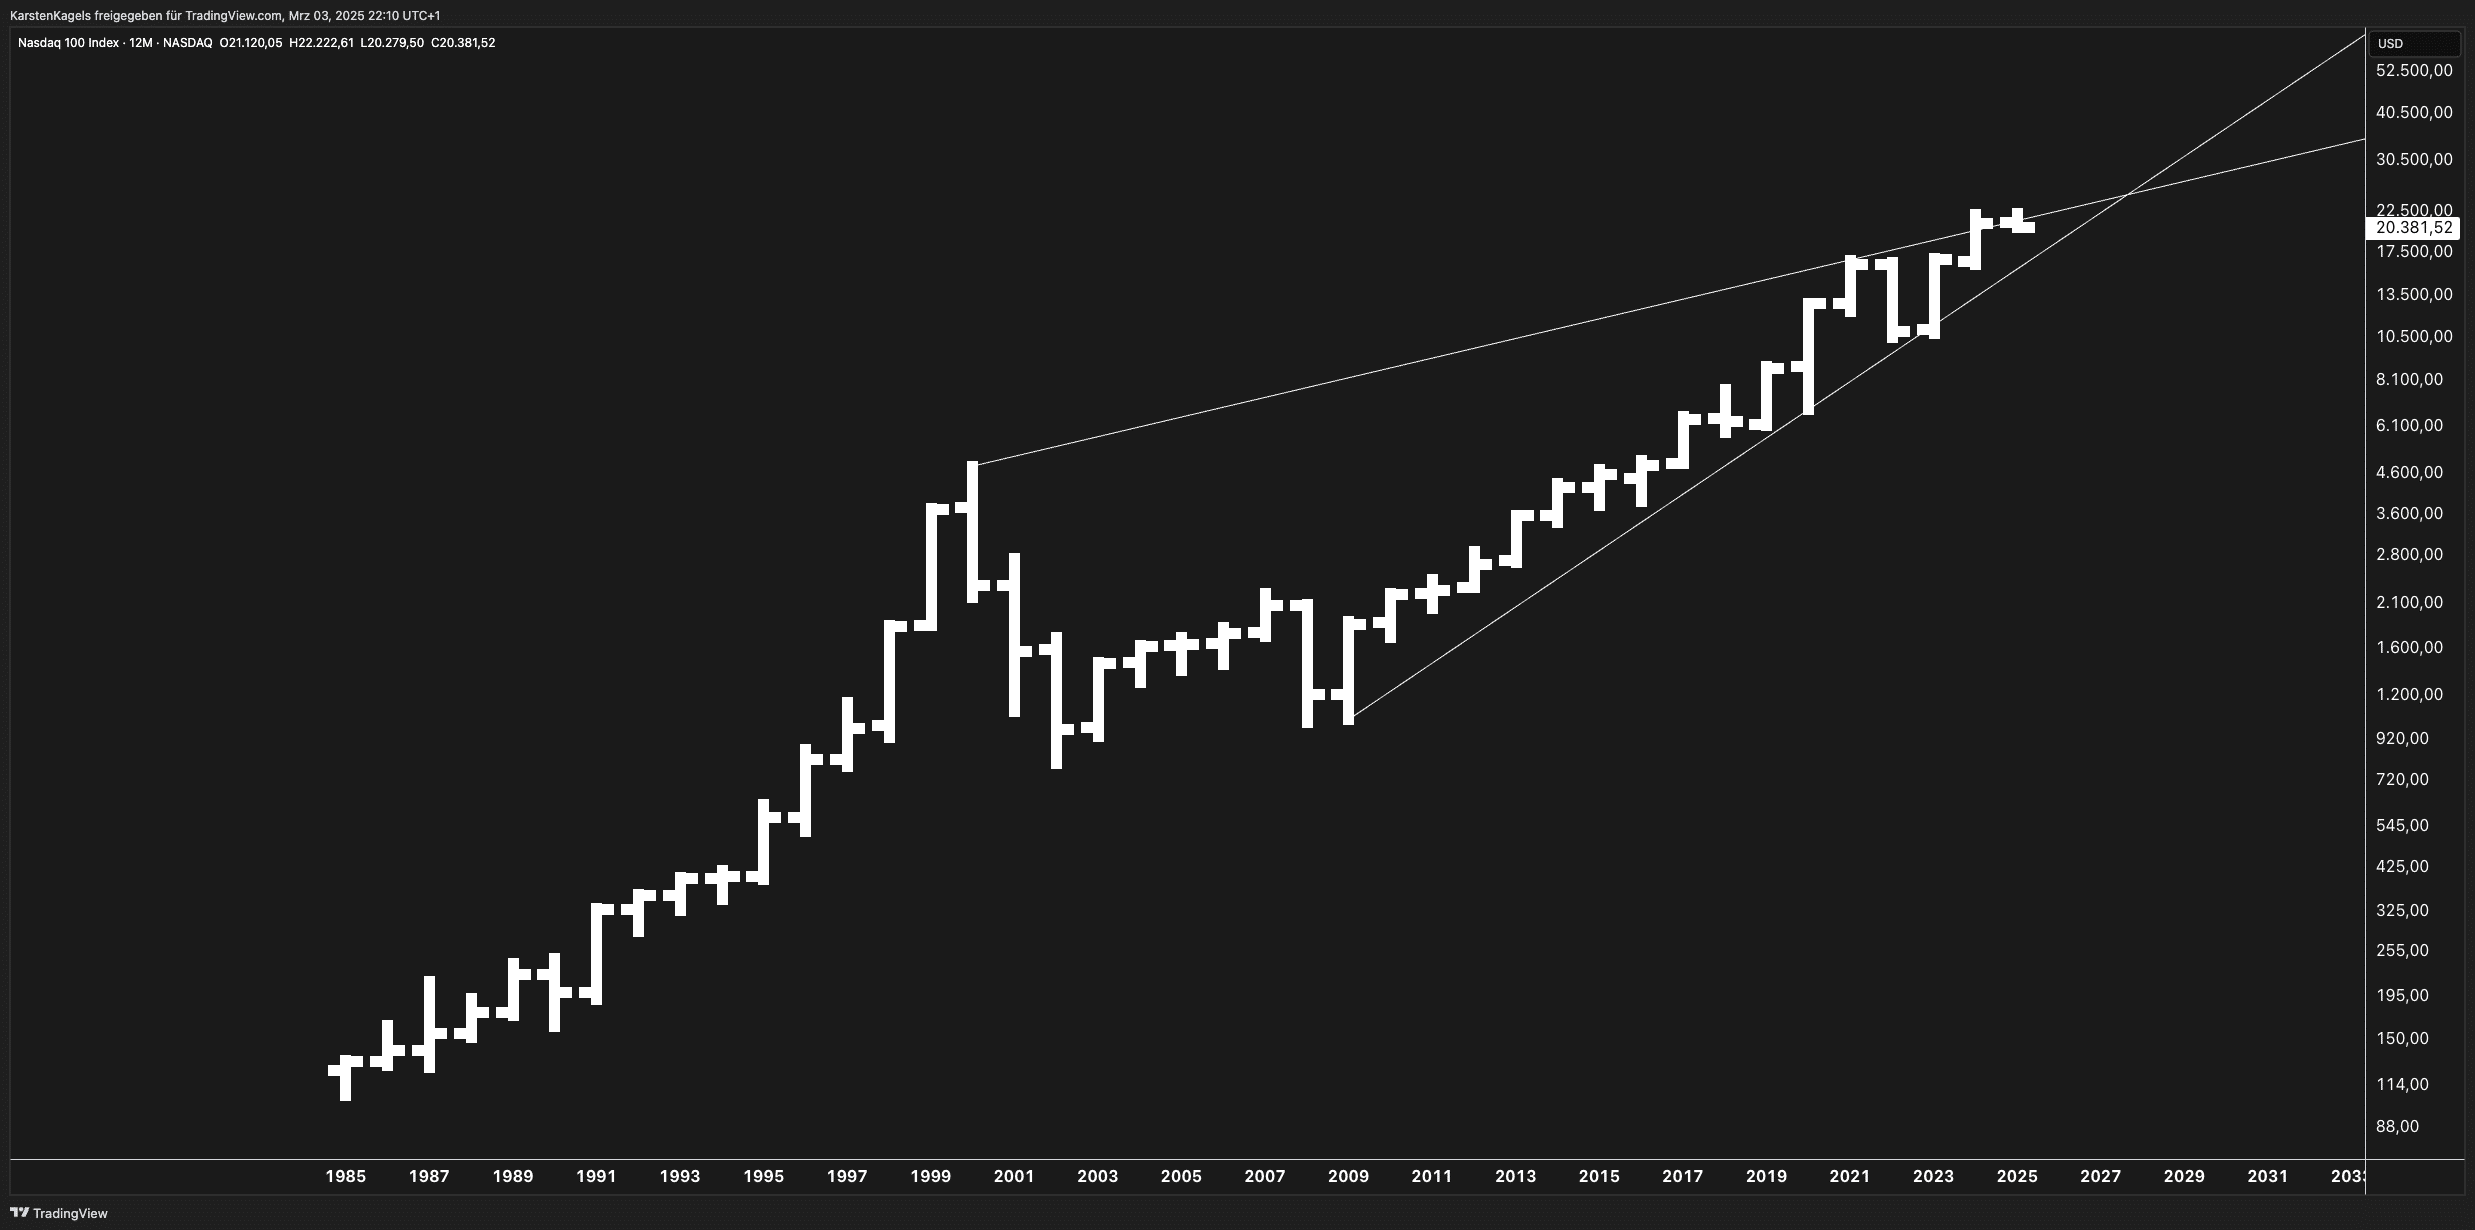
The uploaded NDX long-term chart (1985–2025) highlights a broadening wedge pattern, indicating a potential for increased volatility.
- Resistance Levels:
- The upper trendline suggests resistance near 22,500–23,000 points.
- A breakout above this level could push NDX toward 30,000 and beyond.
- Support Levels:
- The lower trendline points to key support near 17,500–18,000.
- A break below this could signal a larger correction, possibly toward 13,500–14,000.
Fibonacci Retracement & Moving Averages
- The 50% Fibonacci retracement from the 2008 lows to the 2025 highs aligns around 10,500, a major long-term support.
- The 200-month moving average (MA) currently sits near 7,500–8,000, acting as a major long-term bullish threshold.
Historical Trends & Analogues
- 1999 Dot-Com Bubble: The Nasdaq formed a steep parabolic rise before a major crash. Current price action suggests overbought conditions, though market structure differs.
- 2008 Financial Crisis: After a multi-year bull run, the index corrected sharply before resuming an uptrend.
2. Macroeconomic Factors Influencing NDX in 2025–2030
The Nasdaq 100 is heavily influenced by:
a) Federal Reserve Policy & Interest Rates
- Higher interest rates reduce the attractiveness of growth stocks, particularly in the tech sector.
- A rate cut cycle in late 2025 could be a bullish catalyst for NDX.
b) Tech Sector Growth & AI Boom
- Companies in AI, cloud computing, and semiconductor sectors (e.g., NVIDIA, Microsoft) drive Nasdaq’s long-term performance.
- The rise of Quantum Computing & AI-driven automation could create new bullish catalysts.
c) Geopolitical & Economic Risks
- US-China trade tensions and global supply chain disruptions could impact tech companies.
- The US Presidential election (2028) may introduce market volatility, especially regarding Big Tech regulation.
3. Performance Comparison: Nasdaq 100 vs. S&P 500, Commodities, and Bonds
NDX vs. S&P 500
- Historically, the Nasdaq 100 has outperformed the S&P 500, driven by tech-sector dominance.
- However, during bear markets, NDX corrects more sharply than the S&P 500.
NDX vs. Commodities (Gold, Oil, Copper)
- Gold & Bonds outperform during recessions, while NDX performs best during economic expansion.
- The rise of Copper prices (due to electrification & AI infrastructure) suggests an interesting alternative investment.
4. Nasdaq 100 Price Forecast: Bullish, Neutral & Bearish Scenarios
Bullish Scenario (2025–2030): NDX to 30,000+
- The Fed cuts rates, boosting tech stock valuations.
- AI & semiconductor growth accelerates.
- Breakout above 22,500 leads to 30,000+ target.
Neutral Scenario (2025–2030): Range-Bound Market
- NDX fluctuates between 18,000 and 23,000 as macro uncertainty lingers.
- Market consolidates before a potential breakout.
Bearish Scenario (2025–2030): Major Correction to 14,000
- Higher interest rates & economic slowdown impact earnings.
- NDX falls 20–30%, testing support at 14,000–15,000.
5. Investment Strategies for Nasdaq 100 Traders & Investors
For Long-Term Investors
- ETFs like QQQ or QLD offer a diversified Nasdaq 100 investment.
- Dividend-paying tech stocks (e.g., Microsoft, Apple) provide stability.
For Short-Term Traders
- Options strategies (e.g., covered calls, iron condors) for volatility hedging.
- Leveraged ETFs (TQQQ/SQQQ) for aggressive directional trading.
Conclusion: What’s Next for the Nasdaq 100?
The Nasdaq 100’s long-term uptrend remains intact, but technical patterns and macroeconomic shifts indicate key decision points ahead.
- Above 22,500 → Bullish breakout to 30,000+ possible.
- Below 18,000 → Risk of deeper correction to 14,000–15,000.
- Rate cuts & AI expansion are key bullish catalysts.
For traders and investors, staying adaptable with technical levels, macro trends, and risk management is crucial to navigating the next phase of the Nasdaq 100’s historic bull market.